Draw animated hear by Python
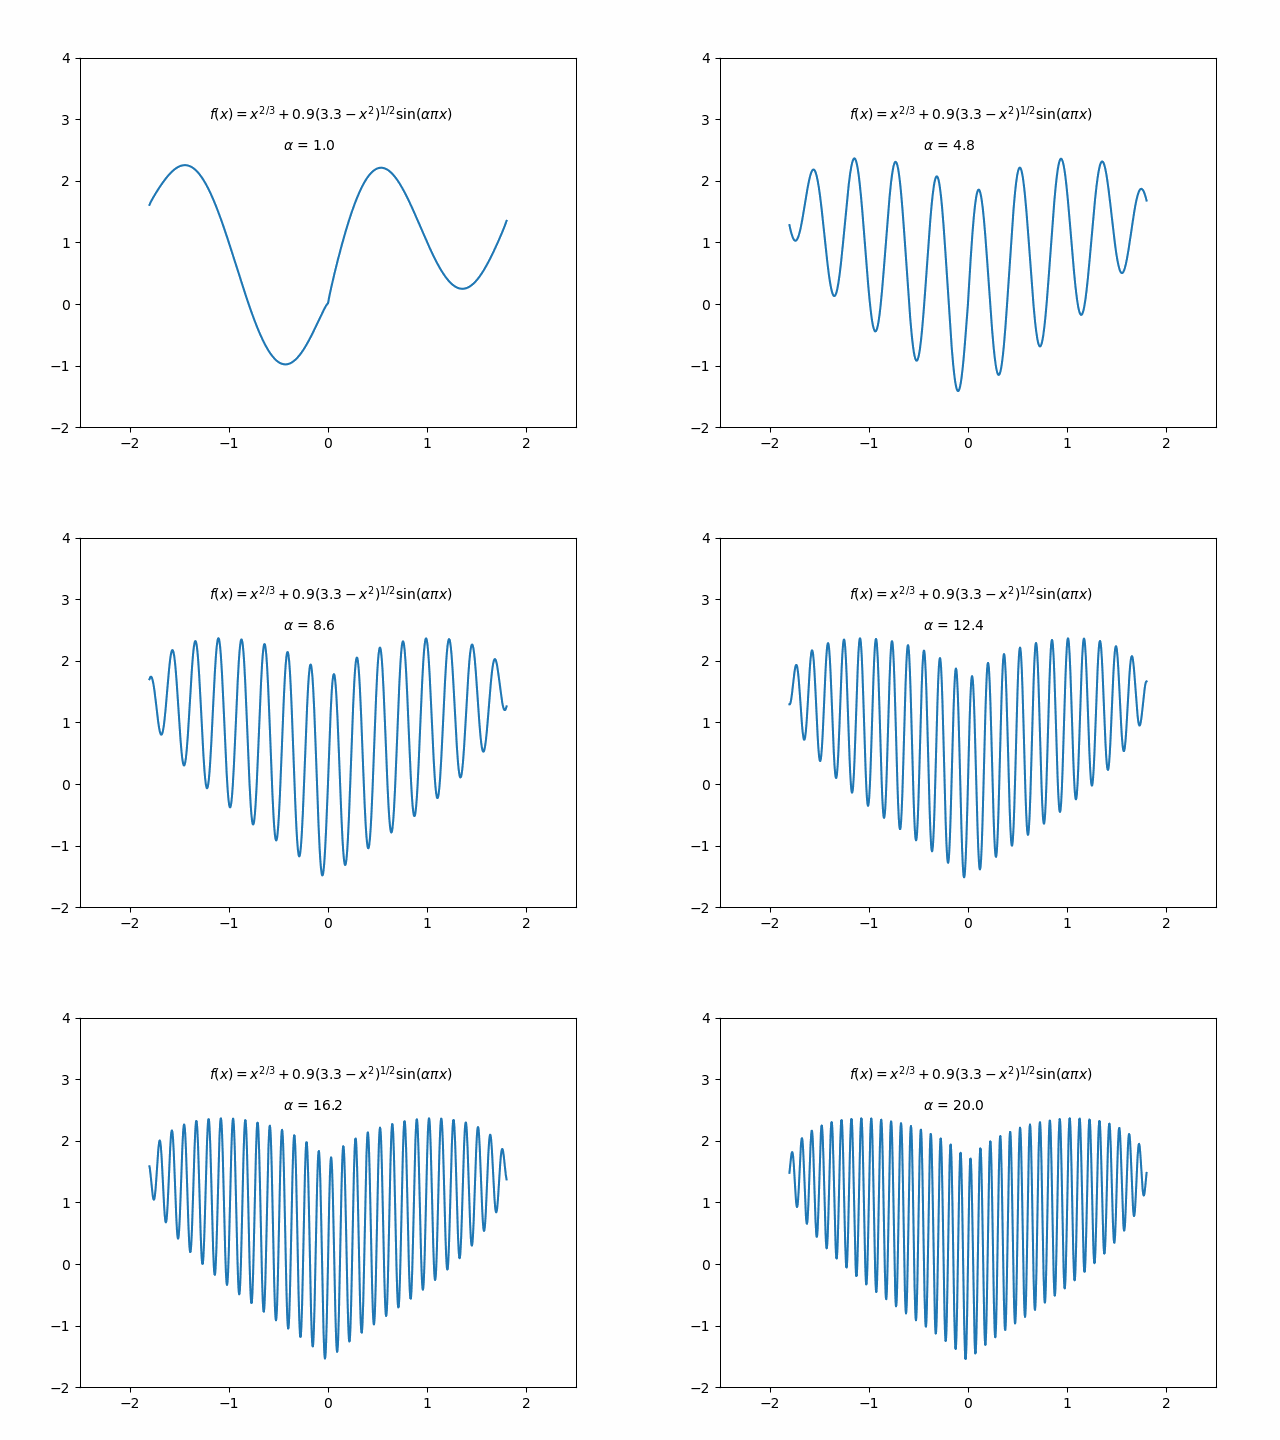
Stumbled upon a dynamic heart-shaped graph implemented by someone using MATLAB on a Chinese TikTok video, I got inspired to recreate it using Python. So I explored two different implementation approaches, and the result is as follows:

Method One:
- Apply looping and combine the parameter pause, clf in pyplot to achieve dynamic image refreshing
import matplotlib.pyplot as plt
import numpy as np


# type %matplotlib qt to shown figure in a separate window
x = np.linspace(-1.8, 1.8, 1000)
alpha = 1

while alpha <= 21:
    plt.xlim(-3, 3)
    plt.ylim(-2, 4)
    y = abs(x)**(2/3) + 0.9*np.sqrt(3.3 - x**2)*np.sin(alpha*(np.pi)*x)
    plt.plot(x, y)

    plt.text(-1.6, 3, r'$f(x)=x^{2/3}+0.9(3.3-x^2)^{1/2}\sin(\alpha\pi x)$')
    alpha_s = str(round(alpha, 2))
    tx = plt.text(-0.5, 2.5, r'$\alpha=$' + alpha_s)
    plt.pause(0.02) # pause 0.02 s
    if alpha <= 20:
        alpha += 0.1
        plt.clf() # clear the current picture
    else:
        break
Method Two:
- make use of the animation function in matplotlib library, achieving animation by updating the coordinates of pictures
- animation can generate
gifformat animated picture
import numpy as np
import matplotlib.pyplot as plt
from matplotlib.animation import FuncAnimation


def animate(alpha):
    x = np.linspace(-1.8,1.8,1000)
    y = abs(x)**(2/3) + 0.9*np.sqrt(3.3 - x**2)*np.sin(alpha*(np.pi)*x)
    PLOT.set_data(x, y)
    time_text.set_text(r'$\alpha$ = ' + str(round(alpha, 2)))
    return PLOT, time_text

fig = plt.figure()
ax = fig.add_subplot(111, xlim=(-2.5, 2.5), ylim=(-2, 4)) # or plt.subplot
PLOT, = ax.plot([], []) # return all the lines
plt.text(-1.2, 3, r'$f(x)=x^{2/3}+0.9(3.3-x^2)^{1/2}\sin(\alpha\pi x)$')
time_text = ax.text(-0.45, 2.5,'') # transform = ax.transAxes

ani = FuncAnimation(fig, animate, frames = np.arange(1, 20.1, 0.1), interval = 20, repeat = False)
ani.save("heart.gif") # save as one gif document
Enjoy Reading This Article?
Here are some more articles you might like to read next: